Determine the reduction in production costs. Methods for calculating product cost reduction
Cost reduction is planned according to two indicators: for comparable commercial products; at costs per 1 rub. commercial products, if in the total output the share of products comparable to the previous year is small. Comparable commercial products include all types of products produced at a given enterprise in the previous period on a mass or serial basis.
The planned amount of cost reduction is determined based on the following calculations.
In terms of comparable commercial products. First, the absolute amount of savings is determined using the formula
Eabs.avg.t.p = NniCbi - NniCni.
Having determined the amount of absolute savings in the planning period, calculate the desired percentage of cost reduction in the planning period (Sav.t.p):
where Eabs.sr.t.p is the absolute savings from reducing the cost of comparable commercial products, thousand rubles; NniCbi - planned production of comparable commercial products at the cost of the reporting period; NniCni - the same, at the cost of the planning period; n is the number of types of comparable commercial products.
In terms of costs per 1 rub. commercial products. Absolute savings from reducing the cost of marketable products in the planning period are calculated using the formula:
Based on the same data, the percentage of cost reduction per 1 ruble is determined. marketable products in the planning period in comparison with the reporting period (S"t.p):
where Ztpb - costs per 1 rub. marketable products in the reporting period, kopecks; Ztpp - the same, in the planning period; TP - cost of marketable products in the planning period, thousand rubles.
It should be borne in mind that the level of costs is influenced by a number of factors, including changes in consumption rates and prices for materials, growth in labor productivity, changes in production volume, etc. In this regard, when calculating, it is necessary to determine the impact of each of them in general effect.
Increasing technical level
Reducing production costs by saving raw materials, supplies and other labor items:
1. Direct calculation method
Em - the amount of savings from cost reduction for this factor;
N0 and Np - norms of expenditure of objects of labor per unit of production before and after the implementation of the corresponding measure (according to the report and plan);
Ts0 and Tsp - price according to the report and according to the plan;
N is the number of units of products produced from the moment the events are carried out until the end of the planned period
2. The method of using indicators of material intensity of commercial products
d0 and dп - the ratio of the cost of basic and auxiliary materials to the output of commercial products before and after the implementation of measures;
TP - volume of marketable products of the planning period;
Emi - savings from cost reduction on the element of material costs;
Imi - index of changes in consumption rates for a given type of material costs;; Ici - index of changes in wholesale prices for a given type of raw material, materials and fuel;
IN - index of growth in commercial output;
d0 - specific type of cost of this type of item of labor in the reporting year in the cost of marketable products
Reducing production costs due to increased labor productivity as a result of the introduction of new equipment and advanced technology
Em - the amount of savings from cost reduction for this factor;
Iз - index of growth of average wages of production workers in the planned period;
Ipr.t - index of growth in labor productivity of production workers in the planned period;
IN - index of growth in the volume of marketable products;
dз - the share of wages with accruals of production workers in the cost of marketable products in the reporting year
2. The method of calculating the release of workers on time-based wages
E=R·Zsr·G·m
P is the number of released workers;
Zsr - average monthly salary of this category of workers;
G - the established percentage of contributions to social insurance;
m - number of months from the moment of implementation of measures until the end of the year
Change in production volume.
1. By the method of calculating relative savings on semi-fixed costs
Eusp - savings on semi-fixed costs;
Pusp - the amount of semi-fixed expenses;
TV - the percentage increase in production volume in the planned year in comparison with the reporting year.
The main sources of reserves for reducing the cost of industrial products are:
increase in production volume due to more complete use of the enterprise's production capacity.
reducing the cost of its production by increasing the level of labor productivity, economical use of raw materials, materials, electricity, fuel, equipment, reducing unproductive costs, manufacturing defects, etc.
The amount of reserves can be determined by the formula:

where Sf, St are, respectively, the actual and possible level of cost of the product; Zd - additional costs necessary to develop reserves for increasing production output.
Savings in labor costs () as a result of the introduction of organizational and technical measures can be calculated by multiplying the difference between the labor intensity of products before the implementation of UTE0 and after the implementation of UTE1 of the corresponding measures by the planned level of average hourly wage (OT) and by the number of products planned for production (VVPpl) .
= (UTE1-UTE0) OTpl VVPpl
The amount of savings will increase by the percentage of deductions from the wage fund included in the cost of production (contributions to the social protection fund, employment fund, for the maintenance of preschool institutions, Chernobyl tax, etc.)
The reserve for reducing material costs () for the production of the planned output of products through the introduction of new technologies and other organizational and technical measures can be determined as follows:
=(UR1-UR0) VVPpl Tspl,
where UR1, UR0 are the consumption of materials per unit of production, respectively, before and after the implementation of organizational and technical measures; Tspl - planned prices for materials.
The reduction in unit cost of production (100 rubles of income) is calculated using the formula:
where Svyp is the cost of completion, rub.;
Cpl – planned cost.
By reducing the cost per unit of production, the enterprise receives cost savings on production and sales of products, which is calculated using the formula:

Example. Determine the reduction in the cost of a unit of production (100 rubles of revenue) and the amount of cost savings due to a reduction in the cost of a unit of production according to the following data: cost of 100 rubles. income according to the plan is 74 rubles, revenue according to the plan is 98,642 thousand rubles, costs of production and sales of products will actually increase by 2.5% compared to the plan, revenue has been fulfilled by 105.6%.
1) Determine the total cost according to the plan:
 rub.
rub.
Zpl=Spl*Vrpl/100=74*98642/100=72995.1 thousand rubles.
2) Let’s determine the costs of production and sales of products to fulfill:
Zvyp=72995.1*102.5/100=74819.97 thousand rubles.
3) Let’s determine the revenue completed:
Vrvyp=98642*105.6/100=104165.95 thousand rubles.
4) Determine the cost of 100 rubles. proceeds from implementation:
Swap=Zvyp/Vrvyp*100=74819.97/104165.95*100=71.83 rub.
5) Determine the reduction in cost of 100 rubles. revenue according to the formula:
6) Let’s determine cost savings by reducing production costs:
Conclusion: The cost of 100 rubles of revenue compared to the plan decreased by 2.17 rubles, which is 2.93% as a percentage, due to a decrease in the cost of 100 rubles. revenue, the company will receive savings in the amount of 2260.4 thousand rubles.
18.5 Sources and factors for reducing costs in communications organizations.
Under sources cost reduction refers to those elements or cost items the amount of which must be reduced in order to reduce cost, under factors the measures that need to be taken to achieve this are understood.
The main sources of cost reduction are:
1) increasing labor productivity, resulting in a reduction in the number of employees and the wage fund;
2) reducing the costs of materials, raw materials, fuel per unit of production;
3) reduction of maintenance costs, production management;
4) improving the use of equipment;
5) acceleration of turnover of working capital.
Cost reduction factors:
1) In-production, depending on the activities of the enterprise itself:
a) technical, aimed at improving the technical level of production;
b) organizational, aimed at improving the organization of production and labor, changing the management structure;
c) structural, aimed at changing the structure and volume of production;
2) Non-production, the change of which does not depend on the activities of the enterprise:
a) established depreciation rates;
b) changes in prices for raw materials received from suppliers;
c) changes in the tariff system and the established minimum wage;
d) changes in tax rates and contributions to the budget and extra-budgetary funds.
Reducing production costs is a complex process that requires compliance with planned standards for the consumption of labor, material and energy resources, efficient use of equipment, and the search for resource saving reserves.
Reducing production costs is achieved as a result of implementing measures in the following areas:
Application of resource-saving technologies that save materials and energy and free up workers;
Strict adherence to technological discipline, leading to a reduction in losses from defects;
Use of technological equipment in cost-effective modes;
Balanced use of production capacity;
Development of an optimal strategy for the technical development of the enterprise, ensuring a rational level of costs for creating the technical potential of the enterprise;
Increasing the organizational level of production, entailing a reduction in losses of working time, the duration of the production cycle and, as a consequence, a reduction in the cost of production and the size of the enterprise’s working capital;
Introduction of effective product quality management systems that contribute to increased competitiveness;
Rationalization of the organizational structure of the production management system, and therefore reducing management costs and increasing its efficiency.
Reserves for reducing costs are available at all levels of the enterprise, therefore it is necessary to develop appropriate organizational and technical measures, the implementation of which will identify these reserves, reduce the cost of production and, consequently, increase the profit of the enterprise.
The development of a plan of organizational and technical measures for the use of internal production reserves is based on the results of an analysis of their sources, on relevant engineering solutions, and technical and economic factors. From the whole variety of technical and economic factors, the following consolidated groups can be distinguished:
Increasing the technical level of production is the process of changing the technical base of an enterprise. The growth of the technical level can be achieved through improvement of: means of labor (the introduction of advanced technology), objects of labor (the introduction of advanced types of raw materials, materials, energy resources); introduction of advanced technology, mechanization and automation of production processes.
Improving the organization of production and labor. This group of factors influences the reduction of costs as a result of specialization of production, improved organization of labor, improved organization of production management, improved logistics and sales, better use of workers' time, and reduction of unnecessary costs.
Changes in production volumes affect the share of semi-fixed costs in the cost of production.
Cost reduction can be achieved through:
Reducing material consumption
where E m – savings in current production costs for raw materials, materials, fuel; N 0 and N 1 – the rate of material consumption before and after the implementation of the event; Ts 0 and Ts 1 – unit price of raw materials, material, fuel before and after the implementation of the event; K M0 and K M1 – coefficient of use of material resources before and after the implementation of the event; Q – annual production volume.
Reducing wages due to increased labor productivity (labor intensity):
 ,
,
where Ezp – wage savings; t 0 and t 1 – labor intensity of a product unit before and after the implementation of the measure in standard hours; To ext. , K d. , K p. - coefficients that take into account compliance with standards, additional salaries, social insurance contributions.
Savings on depreciation as a result of improved utilization of equipment operating time:
E am = [F 0 N a (Q n -Q ss)] Q st,
where F 0 is the initial cost of the equipment; N a – depreciation rate; Q n, Q s. – volume of output at the new and old level of equipment use over time.
Savings on semi-fixed costs (E unit):
![]() ,
,
where Z up is the value of semi-fixed costs; Q сС – production volume before the introduction of measures to increase labor productivity and improve the use of equipment; Q tr – increase in production volume as a result of productivity growth, i.e. Q tr = Q 1 – Q 0, where Q 0 is the volume of production before the implementation of the event; Q isp – increase in production volume as a result of an increase in the level of equipment use over time; those. Q isp =Q n – Q s.
First of all, engineering personnel should be involved in the search for a reserve for reducing costs.
Profit planning.
Profit is the main factor of economic and social development not only for an enterprise, but also for the economy of the country as a whole. Therefore, economically sound profit planning at enterprises is very important.
Profit is planned separately by type, namely:
· profit from the sale of products and goods;
· profit from the sale of other non-commodity products and services;
· profit from the sale of fixed assets;
· profit from the sale of other property and property rights;
· profit from payment for work performed and services provided, etc.;
· profit (loss) from non-operating operations.
The main methods of profit planning are:
· direct counting method;
· analytical method;
· combined calculation method.
Direct counting method
This method is most common in enterprises in modern economic conditions. It is used, as a rule, with a small range of products. Its essence is that profit is calculated as the difference between the proceeds from the sale of products at appropriate prices minus VAT and excise taxes and its full cost. The planned profit (P) is calculated using the formula:
P = (O × C) - (O × C),
where O is the volume of production in the planned period in physical terms; P - price per unit of production (minus VAT and excise taxes); C is the total cost per unit of production.
Profit on commodity output (P tp) is planned on the basis of cost estimates for production and sales of products, which determines the cost of commodity output for the planned period:
P tp = C tp - C tp,
where C tp is the cost of commodity output of the planned period in current selling prices (excluding VAT, excise taxes, trade and sales discounts); C TP - the full cost of marketable products for the planned period.
It is necessary to distinguish the planned amount of profit per commodity output from the profit planned per volume of products sold. Profit on products sold (P rp) is generally calculated using the formula:
P rp = B rp - C rp,
where В рп - planned revenue from sales of products in current prices (excluding VAT, excise taxes, trade and sales discounts); C рп - the full cost of products sold in the coming period.
In more detail, profit from the volume of products sold in the planning period
P rp = P he + P tp - P ok,
where P it is the amount of profit of the balances of unsold products at the beginning of the planning period; P tp - profit from the volume of output of commercial products in the planning period; P ok - profit from the balance of unsold products at the end of the planning period.
This calculation method is applicable for the enlarged direct method of profit planning, when it is easy to determine the volume of products sold in prices and at cost.
A variation of the direct counting method is the assortment profit planning method. With this method, profit is summed up across all product lines. To the result obtained, the profit in the balances of finished products not sold at the beginning of the planning period is added.
Analytical method
This method is used for a large range of products, and also as a supplement to the direct method, since it allows one to identify the influence of individual factors on planned profit. With the analytical method, profit is calculated not for each type of product produced in the planned year, but for all comparable products as a whole. Profit on incomparable products is determined separately. Calculating profit using the analytical method includes three successive stages:
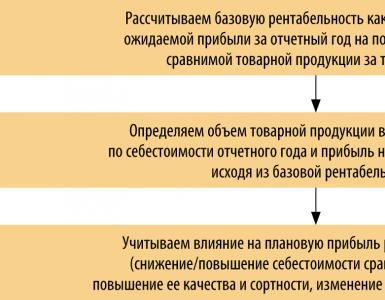
1) determination of basic profitability as the quotient of dividing the expected profit for the reporting year by the full cost of comparable commercial products for the same period;
2) calculating the volume of marketable products in the planning period at the cost of the reporting year and determining the profit on marketable products based on basic profitability;
3) taking into account the influence of various factors on the planned profit: reducing the cost of comparable products, increasing their quality and grade, changing the range, prices, etc.
After performing the calculations for all three stages, the profit from the sale of marketable products is determined.
In addition to profit from the sale of marketable products, profit, as noted earlier, takes into account profit from the sale of other non-commodity products and services, profit from the sale of fixed assets and other property, as well as planned non-operating income and expenses.
Profit from other sales (products and services of subsidiary agriculture, motor vehicles, non-industrial services for capital construction, capital repairs, etc.) is planned using the direct accounting method. The result of other implementations can be both positive and negative.
Profit (loss) from traditional items of non-operating income and expenses (fines, penalties, penalties, etc.) is determined, as a rule, based on the experience of past years.
After calculating profits (losses) for other types of activities, as well as non-operating income and expenses, and taking into account the profit from the sale of marketable products, the gross (total) profit of the enterprise is determined.
Combined calculation method
In this case, elements of the first and second methods are applied. Thus, the cost of marketable products in the prices of the planned year and at the cost of the reporting year is determined by the direct calculation method, and the impact on the planned profit of such factors as changes in costs, improved quality, changes in assortment, prices, etc. is identified using the analytical method.
Receiving a certain amount of profit determines the efficiency of production, but the amount of profit itself does not characterize how efficiently the enterprise operates. To do this, it is necessary to “weigh” a lot of profit against the costs of the enterprise. The profitability indicator meets these goals.
Profitability is a relative indicator of production efficiency, characterizing the level of return on costs and the degree of use of resources, expressed as a percentage. The construction of profitability ratios is based on the ratio of profit (most often, net profit is included in the calculation of profitability indicators) either to the funds spent, or to sales proceeds, or to the assets of the enterprise. Thus, profitability ratios show the degree of efficiency of the company.
The main groups into which profitability indicators can be divided are shown in the table.
Main groups of profitability indicators
| Profitability indicators | Calculation formulas | Purpose |
| Profitability of individual types of products, all commercial products and production | Profit per unit of production / Cost of a unit of Product × 100% Profit per commodity output / Cost of commercial output × 100% Balance sheet (net) profit / Sum of fixed production assets and working capital × 100% | Characterizes the profitability of various types of products, all commercial products and the profitability (profitability) of the enterprise. Serves as a basis for setting prices |
| Profitability of sales (sales) | Profit from sales of products / Revenue from sales × 100% Balance sheet profit / (Net revenue from sales of products + Revenue from other sales and non-sales operations) × 100% | Shows what percentage of profit the company receives from each ruble of sales. Serves as the basis for choosing the range of products |
| Return on assets (capital) Return on current assets Return on net assets | Profit / Total assets × 100% Profit / Current assets × 100% Profit / Net assets × 100% | These complex indicators characterize the return that falls on the ruble of the relevant assets. Reflects the effectiveness of funds invested in the enterprise |
| Return on equity | Net profit / Equity × 100% | Characterizes the profit that accrues per ruble of equity capital after paying interest on the loan and taxes. Characterizes the return or profitability of own funds |
The most commonly used indicators are return on assets (capital), return on net assets, return on equity and return on sales.
In analytical work, the full amount of assets is also often replaced by the value of current assets and the profitability of using the latter is analyzed.
As an indicator of profit, depending on the specific operating conditions, indicators of profit before tax, profit from ordinary activities or net profit are used.
In foreign practice, profit before tax indicators are most often used as the numerator, and some organizations take net profit indicators into account.
The following indicators are used as assets (denominator of the formula):
· value of assets on the balance sheet;
· the value of assets on the balance sheet plus the amount of depreciation on depreciable assets;
· operating assets;
· working capital plus non-current assets.
41. Methodology for drawing up a financial plan for an economic entity (balance of income and expenses).
Financial planning is planning of all its income and areas of spending money to ensure the development of the enterprise. Financial planning is carried out through the preparation of financial plans of different contents and purposes, depending on the objectives and objects of planning.
Based on this, financial plans can be divided into long-term, current and operational.
An example of a combination of long-term and current planning is a business plan, which is usually developed in developed capitalist countries when creating a new enterprise or justifying the production of new types of products. It is compiled for a period of three to five years, since planned developments for longer periods cannot be reliable.
A business plan is not only a financial plan; it is necessary for developing a financing strategy and attracting a specific investor under certain conditions to participate in the creation of a new enterprise or financing a new production program.
Drawing up a business plan undoubtedly contributes to the internal management of an enterprise, since it is developed on the basis of setting goals, methods of their practical implementation, and linking financial, material and labor resources.
Professional preparation of a business plan allows you to save investor funds and reduces the likelihood of bankruptcy. The management of the enterprise is constantly faced with the need to make a choice. It must select the optimal selling price, make decisions in the field of credit and investment policies, and much more.
It is necessary to achieve such a situation that all the activities of the enterprise as a whole are profitable and provide cash receipts in an amount that satisfies the groups of people interested in the results of the enterprise (owners, creditors, etc.). A description of the expected results of economic activity for the future period takes place when drawing up budgets (plans) of an enterprise.
There are short-term and long-term planning. The implications of some of the decisions we make extend over the very long term. This applies, for example, to decisions in such areas as the acquisition of elements of fixed capital, personnel policy, and determination of the range of products. Such decisions determine the activities of the enterprise for many years to come and must be reflected in long-term plans (budgets), where the degree of detail is usually quite low. Long-term plans should be a kind of framework, the components of which are short-term plans.
Basically, enterprises use short-term planning and deal with a planning period of one year. It is impossible to develop general rules establishing the level of budget detail. First of all, they depend on how high the level of reliability of the calculations is. In addition, for each specific enterprise it is necessary to assess the degree of budget detail required to ensure coordination of individual planned actions.
Planning occupies an important place in the financial management system. It is during planning that any business entity comprehensively assesses the state of its finances, identifies opportunities to increase financial resources, and areas for their most effective use.
The object of financial planning is the financial activities of business entities and the state, and the final result is the preparation of financial plans, ranging from the estimate of an individual institution to the consolidated financial balance of the state. Each plan defines income and expenses for a certain period, connections with parts of the financial and credit systems (social insurance contributions, payments to the budget, fees for a bank loan, etc.). All links of the financial system have financial plans, and the form of the financial plan and the composition of its indicators reflect the specifics of the corresponding link of the financial system.
When drawing up a balance of income and expenses, the financial department of an enterprise must be guided by some general principles, the observance of which is mandatory in a market economy. Thus, when determining specific areas for the use of financial resources, one should take into account differences in the level of return received and select costs that ensure extremely high profitability; At the same time, financial costs must be correlated with their payback periods. When choosing long-term costs, it is necessary to provide for the most economical methods of financing them. During financial planning, a balance of risks must be ensured, for which costs with high financial returns, but increased risk, should be reasonably combined with investment of funds, and costs, although less profitable, with a guaranteed income. When choosing areas for investing funds and methods for attracting additional financial resources, you should remember solvency and liquidity in order to prevent the enterprise from going bankrupt.
When drawing up a balance of income and expenses, it is necessary to take into account inflationary processes that have a strong impact on the activities of the enterprise. Profit from production and economic activities, receipts of depreciation charges, costs of capital investments in the production sector and social infrastructure, payments for work performed for the enterprise and services provided, contributions to the reserve fund are influenced by inflation, and therefore the balance of income and expenses must include their appropriate adjustment taking into account the inflation growth index. Currently this is not being done for two reasons. Firstly, there are no relevant methodological materials, the only exception is the Decree of the Government of the Russian Federation on the recalculation of depreciation charges. Secondly, there are no official statistics and forecasts on the value of inflation coefficients necessary to adjust the financial indicators of the balance of income and expenses of an enterprise.
The financial plan of the enterprise reflects the final results of forecast calculations for the entire range of indicators characterizing the receipt of different types of financial resources and the directions of their use. The balance of income and expenses of an enterprise reflects the content of financial processes that mediate all areas of activity of a business entity, and structurally consists of four sections:
Section 1. “Income and receipts of funds.”
Section 2. “Expenses and deductions”
Section 3. “Credit relationships of the enterprise with banking institutions.”
Section 4. “Relationships of the enterprise with the budget and extra-budgetary funds.
Organizations and institutions carrying out non-profit activities independently develop their financial plans. At the same time, institutions financed only from budgetary funds draw up cost estimates, and organizations and institutions that meet their needs not only with budgetary allocations, but also with other types of financial resources, develop cost and income estimates. The main difference between the estimate and the financial plans of enterprises operating on a commercial basis is that the estimate justifies expenses in more detail, while income is reflected only in the context of various sources.
To prepare estimates, control figures and economic standards are used as initial data. Check numbers may include:
· number and composition of the population served by the institution (contingents);
· volume and quality of services provided by the institution (for example, the number of patients admitted to clinics, the number of school graduates, etc.);
· indicators of technical equipment of institutions and availability of transport;
· indicators of social development of labor collectives of relevant institutions.
Economic standards used in financial planning include the following standards:
· budgetary financing of the existing institution;
· formation of the wage fund;
· formation of a fund for industrial and social development;
· formation of a foreign currency allocation fund from foreign currency earnings.
The size of the budget financing standard is determined taking into account scientifically based social norms and standards, the increase in the population's needs for the appropriate type of social services and should ensure reimbursement of material and equivalent costs, the formation of funds for the payment of wages, the creation of the necessary material and technical base, social development and material incentives for the workforce. The standards for budgetary financing of costs serve as the basis for calculating the total amount of financial resources necessary to ensure the activities of the institution, which are related to the provision of free services to legal entities.
The compiled estimate, in addition to the mandatory details (reflecting the name of the institution; indications of the budget from which funding comes; signature of the person who approved the estimate; etc.), includes three large sections:
1 - summary of expenses and income;
2 - production indicators;
3 - calculations and justification of expenses and income.
The first section on expenses indicates:
· Material and related costs.
· Salary fund.
· Fund for Industrial and Social Development.
· Material incentive fund.
· Other funds and reserves.
The first section on income includes:
· Funding from the budget.
· Additional paid services to the population.
· Provision of services under contracts with organizations and enterprises.
· Other supply.
· Revenue from rental of premises and equipment.
The economic and financial activities of public associations combine commercial calculation and estimated financing. This feature is reflected in their financial plans.
42. Methodology for drawing up a financial plan for a business entity
(cash flow plan, credit plan, cash plan).
The final section of the business plan is the financial plan. The financial aspect of the business plan is intended to summarize the materials of the previous sections in cost form. It includes the development of five documents: Balance of income and expenses; Cash flow plan; Credit plan; Payment schedule; Cash plan
CALCULATION OF COST INDICATORS
PRODUCTS.
CALCULATION OF COST REDUCTION.
METHODOLOGICAL INSTRUCTIONS
FOR PRACTICAL LESSON No. 6
by academic discipline
"ECONOMICS OF ORGANIZATION"
for part-time students
getting an education
specialty 2 – 45 02 01 – “Postal communications”
Vitebsk 2016
Compiled by S.P. Kukisheva
Reviewed and approved at a branch meeting
Departments of E&U
Head Phil. Departments _____________ A.P. Toothless
Purpose of the lesson: Mastering the methodology for calculating the cost of a unit of production, calculating the cost of production, reducing the cost of a unit of production and saving costs from reducing the cost of a unit of production.
Literature:
1. Economics of an organization (enterprise). Workshop: textbook. allowance / O. V. Volodko, R. N. Grabar, T. V. Zglyuy; under. ed. O. V. Volodko. – Minsk: Higher School, 2015. – 271 p.
2. Enterprise economics: answers to exam questions / E. S. Rusak, E. I. Sapelkina. – Minsk: tetralit, 2014. – 144 p.
3. Enterprise Economics: textbook. manual / L. N. Nekhorosheva, N. B. Antonova, L. V. Grintsevich [and others]; under. ed. Doctor of Economics sciences, prof. L. N. Nekhorosheva. – Minsk:, 2008. – 719 p.
4. Enterprise Economics: textbook / E. V. Krum. – 2nd ed., revised. - Minsk: TetraSystems, 2013. – 192 p.
5. Enterprise Economics: textbook. / N. L. Nekhorosheva and others, under the general editorship of N. L., Nekhorosheva. - 3rd edition - Mn.: Higher School 2012 - 383 p.
Methodological support: Individual tasks, methodological instructions for their implementation.
Technical support: Microcalculators.
Homework:
1. Classification of costs for production and sales of products
2. Methodology for determining the costs of production and sales of products.
3. Reveal the essence of each cost element that forms the cost of products (works, services) of a communications organization, give examples.
4. Characterize the factors and reserves for reducing the cost of products (works, services) of the organization.
The report must contain:
1. Conditions and initial data of tasks
2. Calculations and necessary explanations for them, units of measurement, conclusions. Make calculations with an accuracy of 0.1
Control questions:
1. How is it calculated and what does product costing show?
2. How is the cost of one hundred rubles of revenue calculated? What is the economic meaning of this indicator?
3. Give the cost elements that form the cost of products (works, services) of a communications organization.
4. Describe the structure of the cost of products (works, services) of a communications organization.
5. List the indicators for reducing the cost of production and sales of products (works, services).
Guidelines for implementation
practical task
The sum of the costs of production and sales of products, expressed in monetary terms, forms a financial and economic indicator of a commercial organization, which is called the cost of production. The economic meaning of the indicator: how many rubles of current expenses were required to generate one hundred rubles of revenue.
The cost per unit of production in communications organizations is determined by the formula
where C is the cost per unit of production (one hundred rubles of revenue), rub.;
Z – costs of production and sales of products, rub.;
B – revenue from sales of products, rub.
Calculation of the cost per unit of production is determined by the formula:
C i = Z i × 100 / V, (2)
where C i is the cost of one hundred rubles of revenue for the i-th cost element, rub.;
B – revenue from sales of products (works, services), rub.
The percentage reduction in unit cost of production (one hundred rubles of revenue) in the planned year is calculated using the formula:
 (3)
(3)
where C PL is the cost of one hundred rubles of revenue according to the plan, rub.;
WITH TEK - the cost of one hundred rubles of revenue in the current year, rub.
Costs can be grouped into economic homogeneous elements:
a) “material costs”: includes the cost of materials and spare parts, all types of fuel and energy;
b) “labor costs”.
For calculation, we determine the wage fund (WF) using the formula
 , (4)
, (4)
Where Payroll- wage fund for employees in the planned year, million rubles.
– average number of other employees in the planned year, people;
t– number of months in the planning period.
c) “contributions for social needs” are calculated in the amount of 34% of the planned wage fund;
d) “depreciation deductions” - the amount of deductions for the complete restoration of the operating system;
d) “other costs”.
Analysis of the structure and calculation of the cost of products (works, services) allows us to find reserves to reduce costs. The amount of cost savings for the production and sale of products (works, services) in the planned year, obtained by reducing the cost of a unit of production (one hundred rubles of revenue) can be determined by the formula
 , (5)
, (5)
Where E
Zpl– costs according to the plan, million rubles;
Zusl– conditional costs, million rubles.
 (6)
(6)
Where Zusl– notional amount of costs, million rubles;
Stack- cost per unit of production (one hundred rubles of revenue) in the current year, rubles;
Vpl– revenue in the planned year, million rubles.
Cost savings (or overspending) in the report compared to the plan:
 , (7)
, (7)
Where E- cost savings on production and sales of products (works, services), million rubles;
3 ISSUE– actual costs incurred for the production and sale of products (works, services), million rubles;
Z USL– conditional costs for the production and sale of products (works, services), calculated according to the planned cost and actual revenue, million rubles.
Notional amount of costs in the report compared to the plan:
 , (8)
, (8)
Where Z USL- notional amount of costs, million rubles;
With submarine– cost per unit of production (one hundred rubles of revenue) according to plan, rub.
IN ISSUE– actual realized revenue, million rubles.
Problem 1
Determine the cost per unit of production (one hundred rubles of revenue) based on the following data:.
1. Labor costs - 410510.4 million rubles.
2. Material costs - 91840.4 million rubles.
3. Depreciation charges - 86295.4 million rubles.
4. Other costs - 98810.6 million rubles.
5. Revenue of the organization - 1125100.1 million rubles.
Explain the economic meaning of the calculated indicator
Problem 2
Calculate the cost estimate for each cost element based on the following data:
1. Labor costs - 21689.3 million rubles.
2. Contributions for social needs - determine
3. Depreciation charges - 18442.1 million rubles.
4. Material costs - 13428.9 million rubles.
5. Other costs - 9632.6 million rubles.
6. Revenue from sales of products (works, services) - 74152.4 million rubles.
Determine the nature of production. Explain the economic meaning of the calculated indicator
Problem 3
Plan the cost per unit of production and the % reduction in the cost of the organization. Draw conclusions
Initial data:
1. Current year:
Revenue from sales of products (works, services) - 2850 million rubles
Depreciation charges - 766 million rubles.
The share of depreciation charges is 32% of the total costs.
2. Planned year:
Revenue from sales of products (works, services) 3140 million rubles.
Production and sales costs increased by 3.6%
Problem 4
Determine the percentage reduction in unit cost of production in the planned year compared to the current year. The source data is in Table 1.
Table 1 - Initial data
Problem 5
Determine the percentage reduction in the unit cost of production (one hundred rubles of revenue) and the amount of cost savings obtained by reducing the cost of a unit of production (one hundred rubles of revenue). Initial data:
Revenue from sales of products (works, services) 617.3 million rubles.
Labor costs – 123 million rubles. The share of labor costs is 23% in the total costs of production and sales of products (works, services).
2. Execution of the plan:
Revenue from sales of products (works, services) 672.8 million rubles.
Costs for production and sales of products (work, services) increased compared to plan by 4.4%.
Problem 6
Calculate the amount of cost savings for production and sales of products by reducing the unit cost of production.
Table 1 – Initial data
Related information.
Note. The text of the problem was taken from the forum.
Task. Determine cost reduction
In the reporting year, ore production at the mine amounted to 1,850 thousand tons. For the planned year it is planned to increase production to 1980 thousand tons. The cost of 1 ton of ore in the reporting year is 98 UAH 30 kopecks, including conditionally fixed costs of 44 UAH 50 kopecks.Define:
1. Reducing the cost of ore due to increased production volume (in%)
2. Cost of 1 ton of ore in the planning year
A comment.
Thanks to the teachers for replacing “rubles” with hryvnias, but... this was the cost of ore mining around the 80s of the 20th century. That is, the task has been preserved “since the times of Soviet power.” It was worth at least taking an interest in the real figures in the mining industry.
The task, again, is simply on the student’s ability to count in a column. Requires knowledge within the 6th grade of secondary school and a general understanding of the principle of "variable costs / fixed costs." So, approximately 9th grade. In extreme cases, it will be suitable for a technical school.
It should be noted that the author of the problem understands the term “cost” as the full cost of marketable products. Because under other assumptions, the problem simply cannot be solved, since we are talking exclusively about ore production, but not a word about sales. And in “real life” semi-fixed costs will be written off not on extracted, but on sold products! For some reason, university teachers forget about such “little things.”
An economist should at least think about the level of growth of semi-fixed costs based on inflation data and expectations of wage growth, etc.
Solution.
We define conditionally variable expenses.
98.30 - 44.50 = 53.80 hryvnia per ton
We determine the level of semi-fixed expenses.
44.50 * 1,850 = 82,325 thousand hryvnia
Determining the level of semi-variable expenses
53.80 * 1,980 = 106,524 thousand hryvnia
Total production costs will be
82,325 + 106,524 = 188,849 thousand hryvnia
Planned cost per ton of marketable products (see comment)
188,849 / 1,980 = 95.38 hryvnia per ton
The reduction in the planned cost of marketable products due to an increase in production volumes will be:
(98,30 - 95,38) / 98,30 * 100% = 2,97%
Answer: 1) 2,97% 2) 95,38
Task. Determine material cost reduction
In the planning period, material cost rates and planned prices for its purchase change. These changes are characterized by the following data:
Determine the overall reduction in material costs in the planning period in absolute and percentage terms.
Solution.
To produce one item for each of the products in the base year.
Costs for one product A in the base year = 0.9*184=165.6 UAH.
Costs for one product B in the base year = 0.15*198=29.7 UAH.
Costs for one product B in the base year = 1.5*172=258 UAH.
Let's find production costs all products in the base year.
Costs for products A = 400 * 165.6 = 66240 UAH.
Costs for products B = 1200 * 29.7 = 35640 UAH.
Costs for products B = 800*258=206400 UAH.
Let's find the costs of material resources to produce one item for each product in the plan year.
Costs for one product A in the planning year = 0.8 * 191 = 152.8 UAH.
Costs for one product B in the planning year = 0.10 * 202 = 20.2 UAH.
Costs for one product B in the planning year = 1.4 * 175 = 245 UAH.
Let's find production costs about all products in the planning year.
Costs for products A = 400*152.8=61120 UAH.
Costs for product B = 1200 * 20.2 = 24240 UAH.
Costs for product B = 800*245 = 196,000 UAH.
In the planning period in value terms for each product.
Reducing costs for products A = 66240-61120 = 5120 UAH.
Reducing costs for products B = 35640-24240 = 11400 UAH.
Reducing costs for products B = 206400-196000 = 10400 UAH.
Find a reduction in material costs in the planning period in relative terms for each product.
Cost reduction for products A = 61120/66240 = 0.9227
1-0,9227= 0,0773
Resource costs decreased by 7.73%
Reduced costs for products B = 24240/35640 = 0.6801
1-0,6801= 0,3199
Resource costs decreased by 31.99%
Reduced costs for products B = 196000/206400 = 0.9496
1-0,9496= 0,0504
Resource costs decreased by 5.04%
Find the cost reduction for all products in the planning period in value terms.
Cost reduction for all products = (66240+35640+206400)-(61120+24240+196000)=308280-281360=26920 UAH.
Let's find the cost reduction in relative terms and for all products in the planning period.
Cost reduction in relative terms = 281360/308280 = 0.9127
Resource costs decreased by 8.7%
Answer: total costs for production of products decreased by 26,920 UAH. in the planning period. In relative terms, the decrease was 8.7%. The most effective was the reduction in costs for product B. The savings amounted to 11,400 UAH.
Task. Selecting a cost reduction project
The Interval enterprise produces products B and D. In the planning year, the company's managers are tasked with reducing the cost of production for one of the products in such a way that the greatest cost savings are achieved. Product output in the planned year remains unchanged.
Determine and justify for which product the cost should be reduced. Set prices for products that the enterprise produces and determine the profit of the enterprise in the planning year. Data for calculations are given in the table.